


Data on student’s family income released for the first time to increase transparency
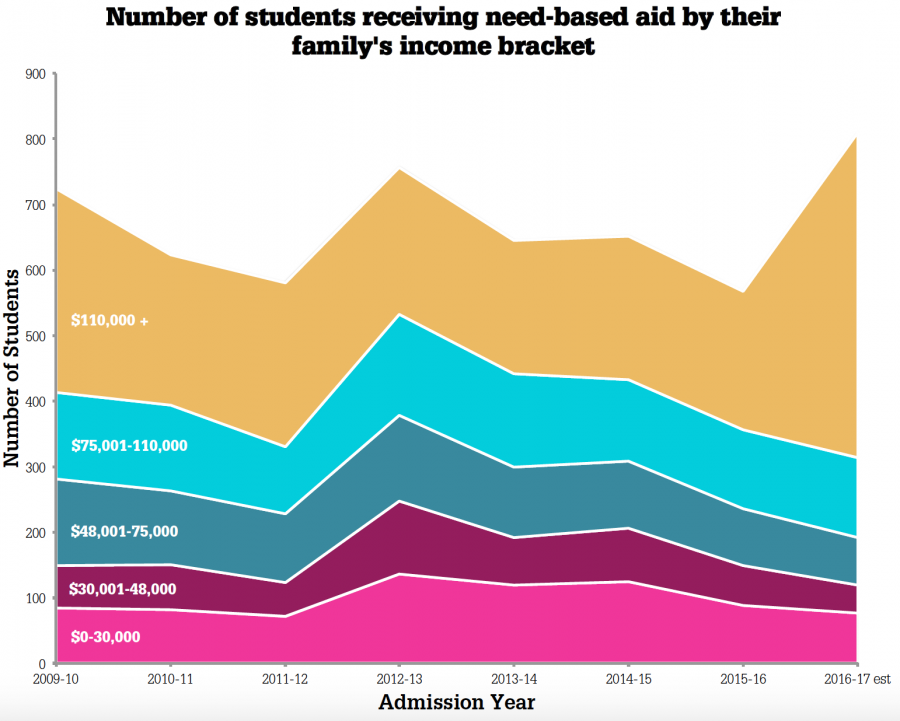
Each colored layer represents a different income bracket. The height of a colored layer represents the number of students whose family’s income falls within that bracket, in that year. For example, in the 2012-2013 school year, there were approximetly 200 students in the gold-colored 110,000+ income bracket.
March 3, 2017
Data on the family income of students receiving need-based financial aid was made public for the first time by Case Western Reserve University. The number of students whose family income falls within five select income brackets was released to the Undergraduate Student Government’s (USG) during their General Assembly on Feb. 21. It was provided as an act of transparency, in part as a reaction to a USG resolution passed in October 2016. USG is expected to publicize the brackets in their newsletter on Friday, March 3, as part of an effort to increase the clarity of CWRU’s admissions practices under new admission policies adopted in the fall of 2016.
Under the new policies, Undergraduate Admissions may use the level of family income of students as a factor in their admission. These policies are currently in place for the 2016-2017 application cycle for the class of 2021 and are known as ‘need-aware’; the policies before, wherein income would not be a factor, are termed ‘need-blind’.
The model for the income levels of each bracket was based on reports published by Vanderbilt University. The two extremes of the brackets range below $30,000 to over $110,000; the middle brackets range from between $30,000 and $48,000 to $75,000 and finally to $110,000.
Compared to the 2009-2010 school year, estimates of the current 2016-2017 year contain the fewest number of students whose families report an income of $30,000-$48,000 and $48,001-$75,000, with 42 and 73 students respectively. The lowest income bracket, itself, in the current 2016-2017 school year contains 77 students. The second-highest bracket contains 122 students.
A total of 495 students receiving need-based aid in the current academic year are estimated to report a family income of $110,000 or more. The number of students in that income bracket more than doubled, compared to last year, due to a change in student reporting practices. According to Ward, the introduction of a new loan, not considered need-based, required students from upper income brackets to report financial information to the Office of Financial Aid and resulted in a spike in the number of students found in the highest brackets.
“I don’t think it’s really socioeconomically diverse enough to only have 300 students total in each class making under $110,000,” said Brian Ward, president of USG. “This is alarming and I’m really hopeful that the new admissions policies will help positively change these numbers.”
USG hopes to monitor the efficacy of these new admission policies and to preserve socioeconomic diversity in the student population and thus passed resolution R. 26-01, “A Call for Accountability in the Admissions Policy and Increased Financial Transparency,” in October 2016. The resolution asks for the public release of specific financial information of incoming students from the CWRU administration. Student income brackets from the past few years were part of that pool of information requested in the resolution. The resolution also calls for the income brackets for future years to be continuously released to the public.
“The overwhelming concern was that [the policy] would negatively affect students from low income brackets, or that it could have a dumbbell effect where you have an increase of low income students and an increase of really high income students, but students in the middle class could suffer from the policy,” explained Ward.
USG is working with Provost William Baeslack to acquire other information that will be valuable in assessing the success of the new admissions policies. Such information includes the breakdown of tuition forms and CWRU budgets. Unlike the income brackets, however, this information is may be more dense.
“The provost has been very willing if there are specific things we want to know about,” said Ward. “They are open if there are specific things we are looking for. It’s just that they don’t want to give us a data dump.”
Ward thinks that the continued public release of these numbers will allow students to observe the effects of the new admissions policies. He also believes it allows students to assess whether the implemented policies are meeting the goal of expanding socioeconomic diversity or not.
“There’s a lot of trust issues between students and the administrators, and the willingness of the administration to give out raw data like this builds more trust,” noted Ward. “By being able to look at the data themselves, [students] can draw their own conclusions over whether or not the policy is working.”